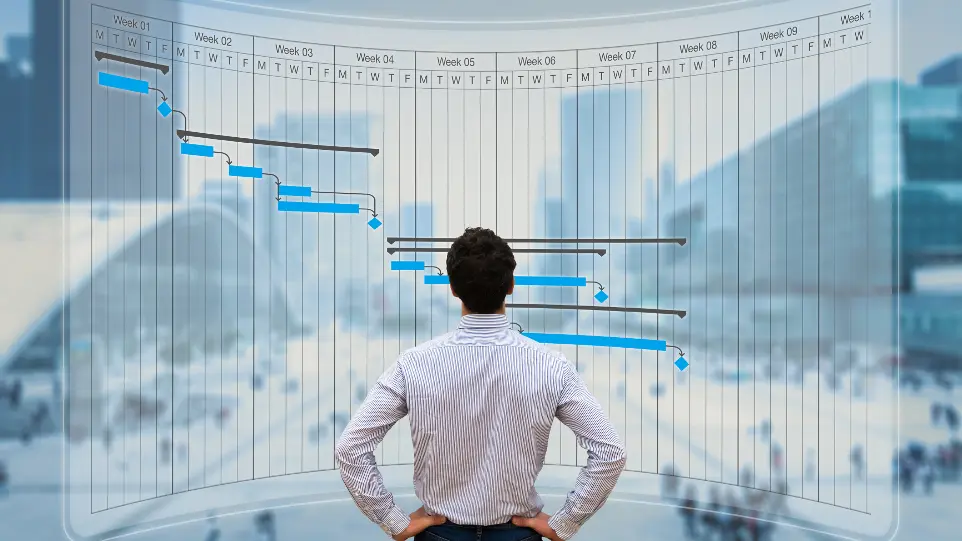
Visualize your Project Timeline
Welcome to the Project Gantt Chart Template. This powerful tool is designed to help you visualize and manage your project timelines effectively. A Gantt chart provides a graphical representation of your project's schedule, showing the start and finish dates of various elements. This template is an essential asset for planning, coordinating, and tracking tasks within your project.
On this page, you can download free, fully customizable Gantt Chart templates in Excel format to streamline your project planning and management. Whether you're managing a small project or a large-scale operation, this templates are designed to be easy to use and modify for your unique needs.
By utilizing this template, you will gain a clear overview of your project’s progress, ensuring that all tasks are on track and deadlines are met. Engage with your project team to collaboratively complete this Gantt chart, which will serve as a dynamic roadmap for your project's successful execution.
FEATURES

Visual Timeline
Clearly see task durations, start and end dates, with automated timeline view.
Resource Allocation
Assign and track resources across different tasks and project phases.
Progress Tracking
Monitor task completion and overall project progress at a glance.
Progress Indicators
Included color coded progress bars to visually track task completion.
HOW TO USE
Step by step guide to use this template
FAQs
Frequently Asked Questions
Absolutely! Our templates are designed to be user-friendly for all experience levels. Beginners will find them an excellent starting point to learn project management best practices, while seasoned professionals can leverage them to streamline their processes.
Yes, you can use these templates for both personal and commercial projects. We provide them under a Creative Commons Attribution license, which means you're free to use and modify them as needed, as long as you provide attribution
We're constantly developing new templates and updating existing ones. On average, we add 2-3 new templates each month and review our entire collection quarterly. Subscribe to our newsletter to stay informed about the latest additions!
While our core templates are designed to be versatile across industries, we do offer specialized templates for sectors like IT, construction, and marketing. If you need a template for a specific industry not currently covered, please reach out – we're always expanding our collection based on user needs.
We offer several resources to help you customize our templates:
- Check the "How to Use These Templates" guide above.
- For personalized assistance, don't hesitate to contact me directly.
Yes, I provide expert consultation services to help you optimize your project management processes. Whether you need help implementing these templates or require broader project management guidance, let's discuss how I can support your success.
Have a question not answered here? Reach out ⬇️, and I'll be happy to assist you!

Need a Custom Template?
I'm here to help! Contact me to discuss your specific requirements.
